Compass

Scorecards for software health

2021 - 2022
Service Health scorecard details for Vegastars components listing five services with varying scores from 0% to 100%, including owner team and descriptions.
Project overview
When Compass entered Beta, I led the first iteration of the Scorecards feature, which enables teams to evaluate the health of their software components using customizable best-practice criteria. I ran research with DevOps and platform engineers to identify which signals and standards they rely on, and how they determine whether a service is healthy, at risk, or failing. Those findings shaped the scoring model, criteria structure, and evaluation experience, turning complex operational concepts into a practical, configurable framework teams could apply across their services.
Service Health scorecard details page showing component scores, descriptions, owner teams, and scores for Vegastars components with icons indicating status.Compass software interface showing team health details including components status, low scoring metrics, and a section for team reflections on operations for the week of September 7, 2021.
Webpage showing Compass scorecards with sections for Most used and All scorecards, listing scorecard names, descriptions, applicability, and owners.Web interface for creating a scorecard with criteria including availability over last 28 days weighted at 60%, uptime at 33%, and on-call at 34%, showing total weight of 127%.

Design challenge

  • Defining what “software health” means across teams with different DevOps practices, maturity levels, and success metrics
  • Translating complex operational signals and best-practice criteria into a scoring model users could easily understand and trust
  • Designing health thresholds (passing, at-risk, failing) that felt meaningful and actionable rather than arbitrary
  • Balancing configurability with usability so organizations could define their own standards without overwhelming teams
  • Creating a scoring and criteria framework flexible enough to apply across many component types and service architectures
  • Supporting both quick health assessment and deeper diagnostic detail in the same experience
  • Designing for an emerging product category with limited competitive patterns and few established UX conventions
  • Ensuring score outputs drove action and improvement — not just passive reporting

My role

  • Led end-to-end UX design for the first Scorecards experience in Compass Beta, defining how teams evaluate and track software component health
  • Conducted discovery and validation research with internal DevOps engineers and external users to identify trusted health signals, decision criteria, and scoring thresholds
  • Ran user testing on early Scorecards concepts and flows to validate clarity, usefulness, and interpretation of health status and scoring outcomes
  • Performed deep competitive analysis across adjacent DevOps and service health tools to identify gaps, patterns, and differentiation opportunities in an emerging product category
  • Translated research findings into a criteria and scoring framework aligned with real engineering mental models of healthy, at-risk, and failing services
  • Shaped the criteria structure, weighting model, and evaluation UX to balance configurability with usability
  • Partnered with product and engineering to align scoring logic and system behavior with user expectations and operational workflows
Service readiness scorecard showing 40% completion, status failing, owned by Jonathon Lowe, applied to 38 components labeled Vegastars, with a checklist of unmet and met criteria for service readiness.

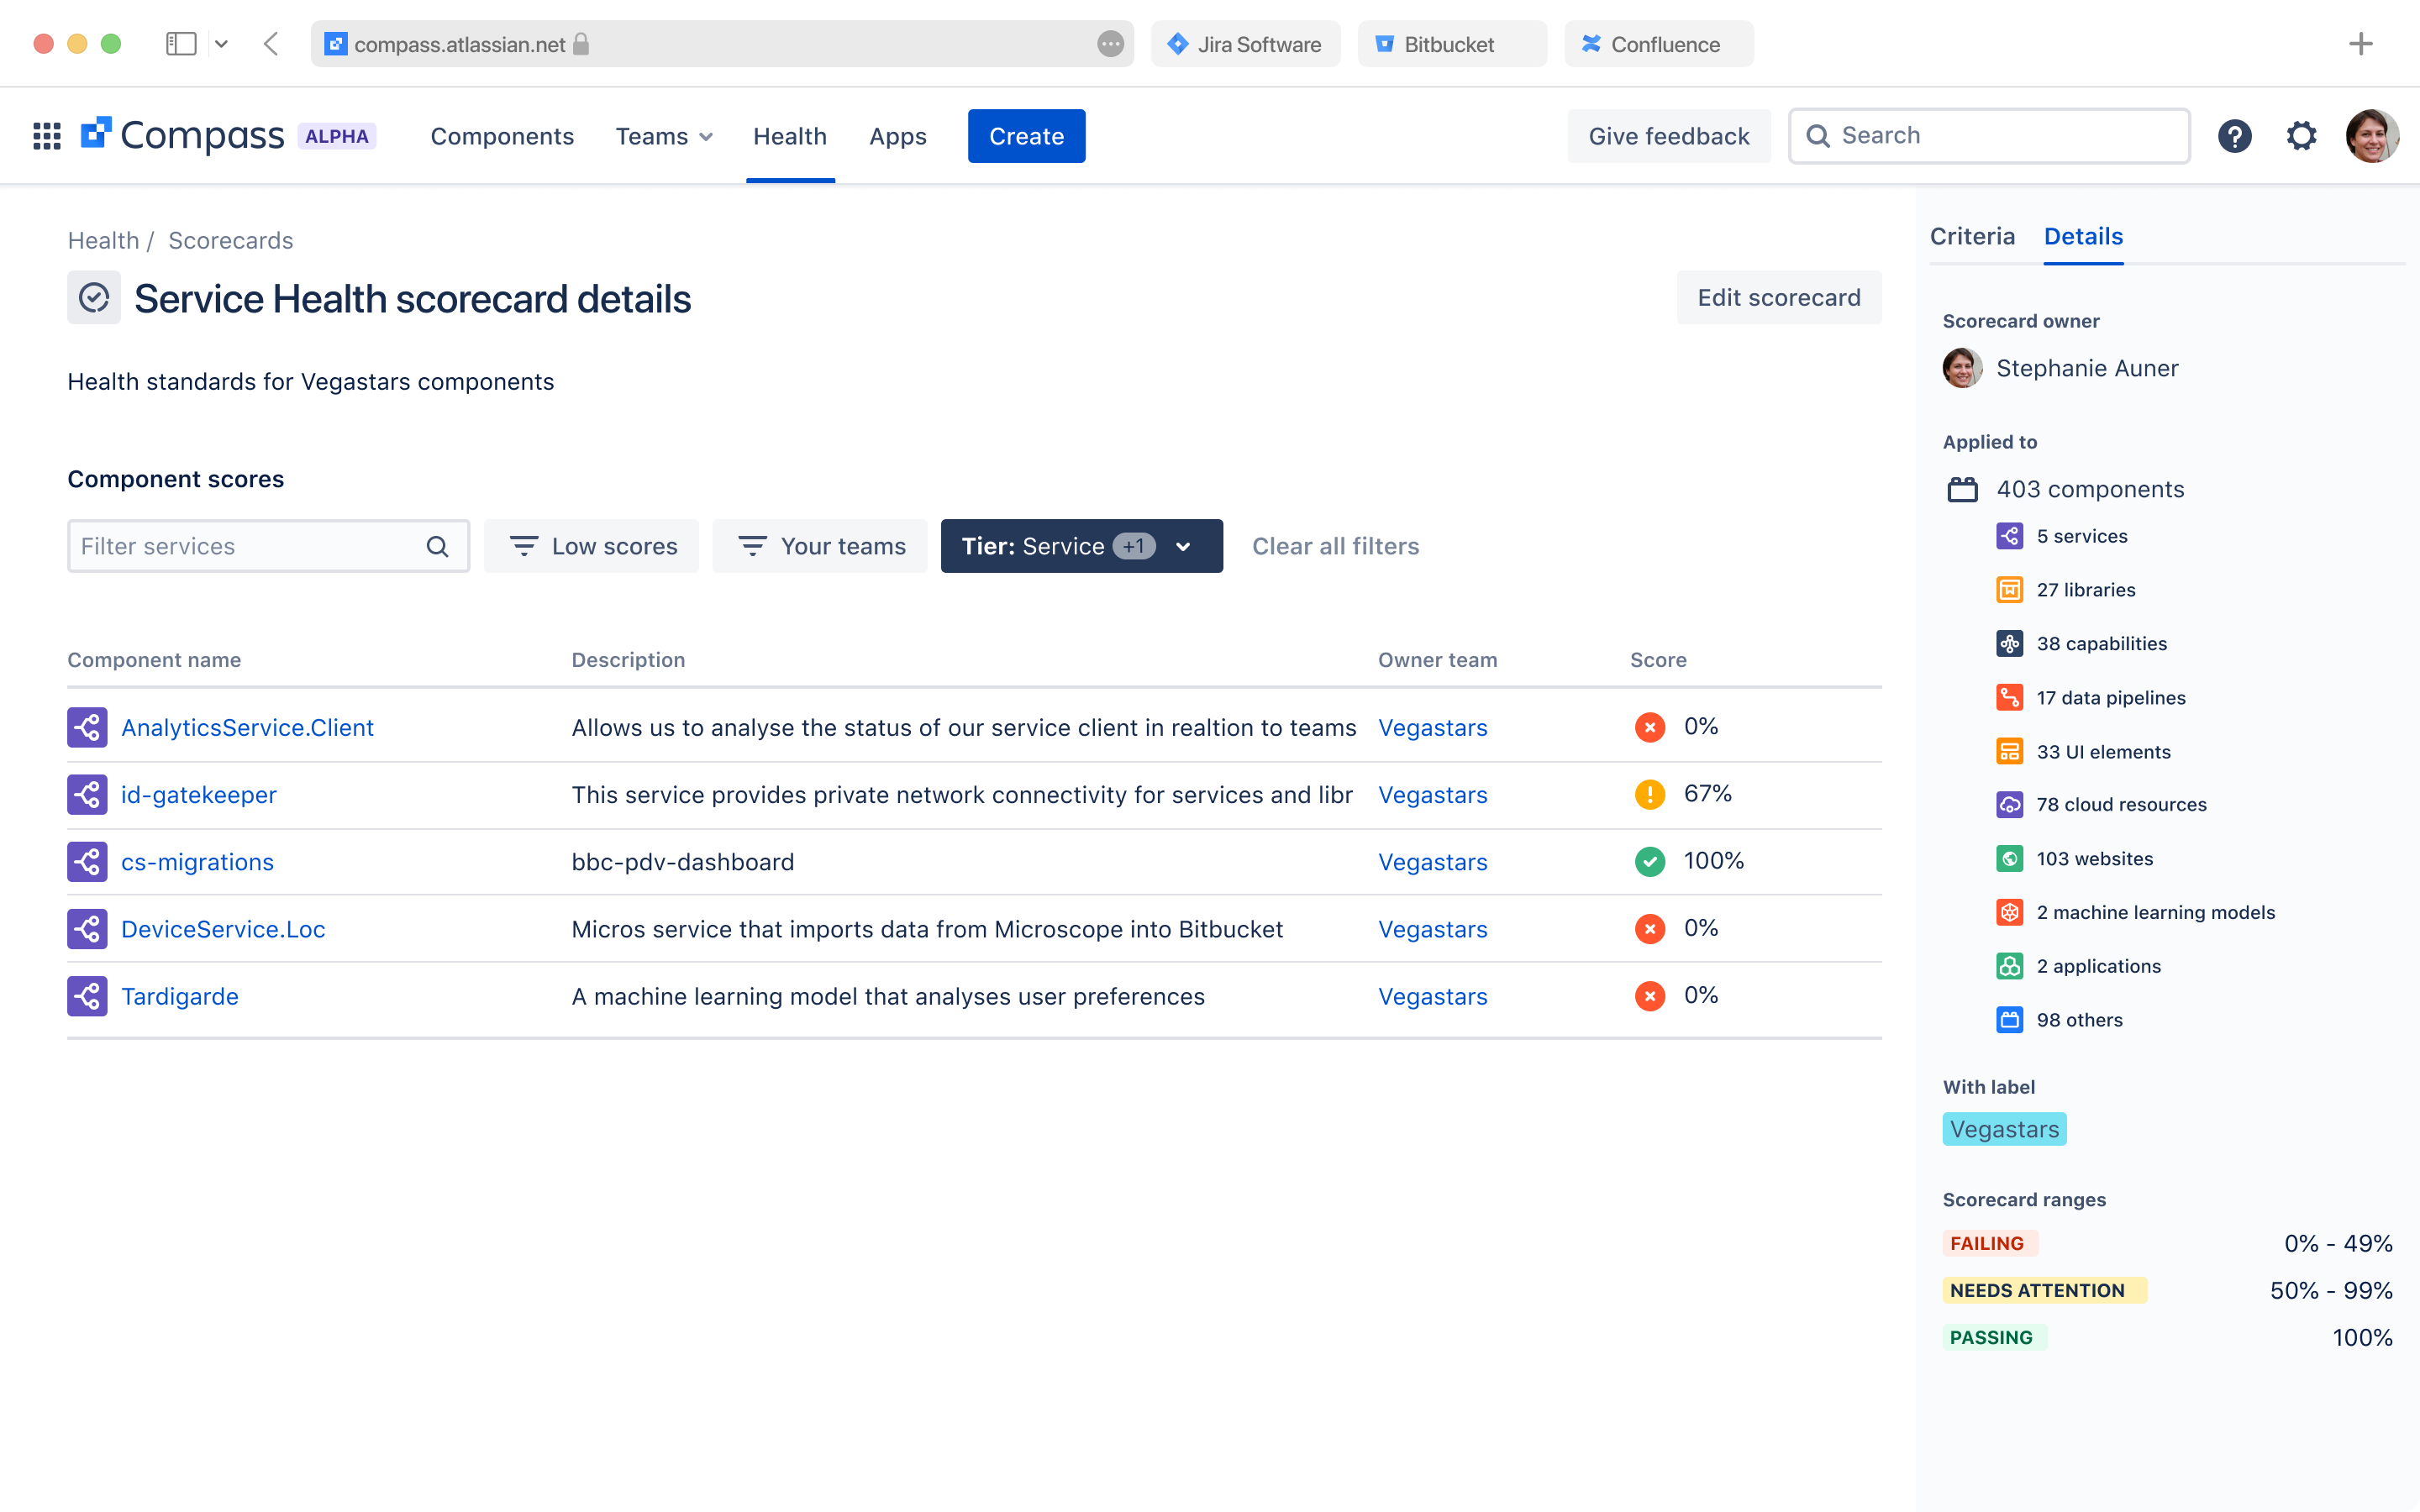
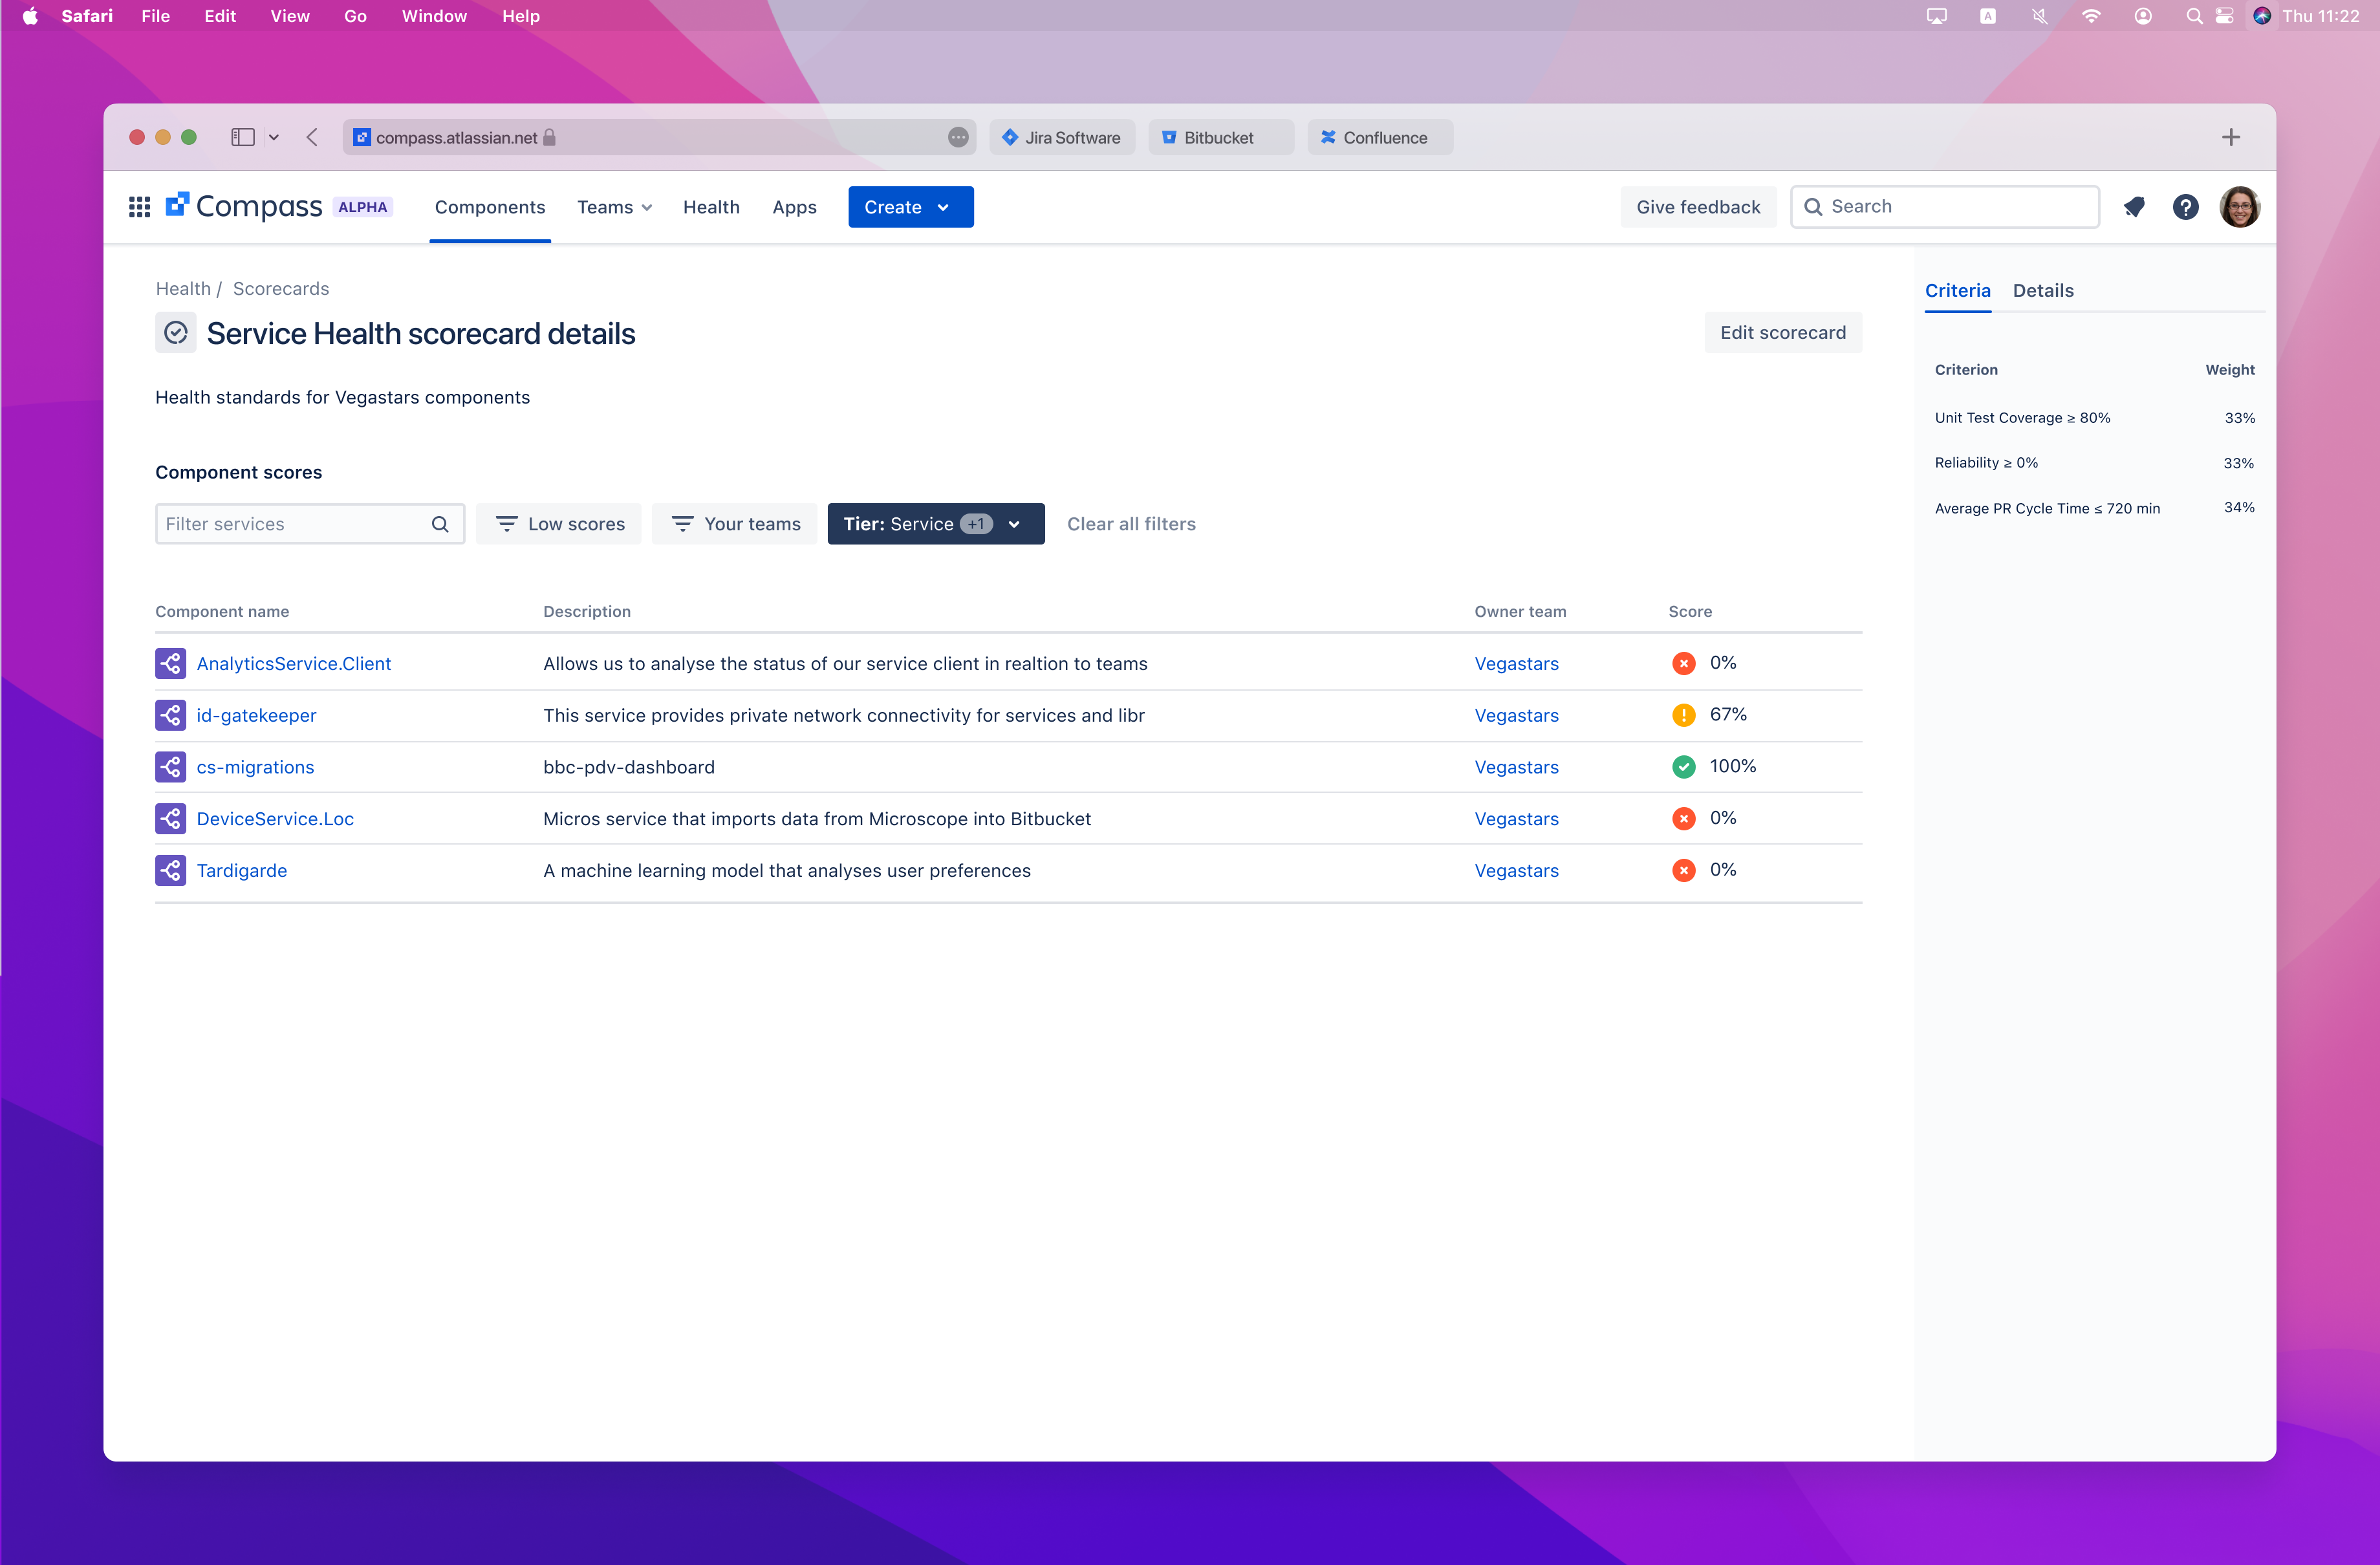
Instant health signal

Teams can assess service readiness in seconds through a clear score visualization and status indicator, reducing time spent interpreting raw metrics.

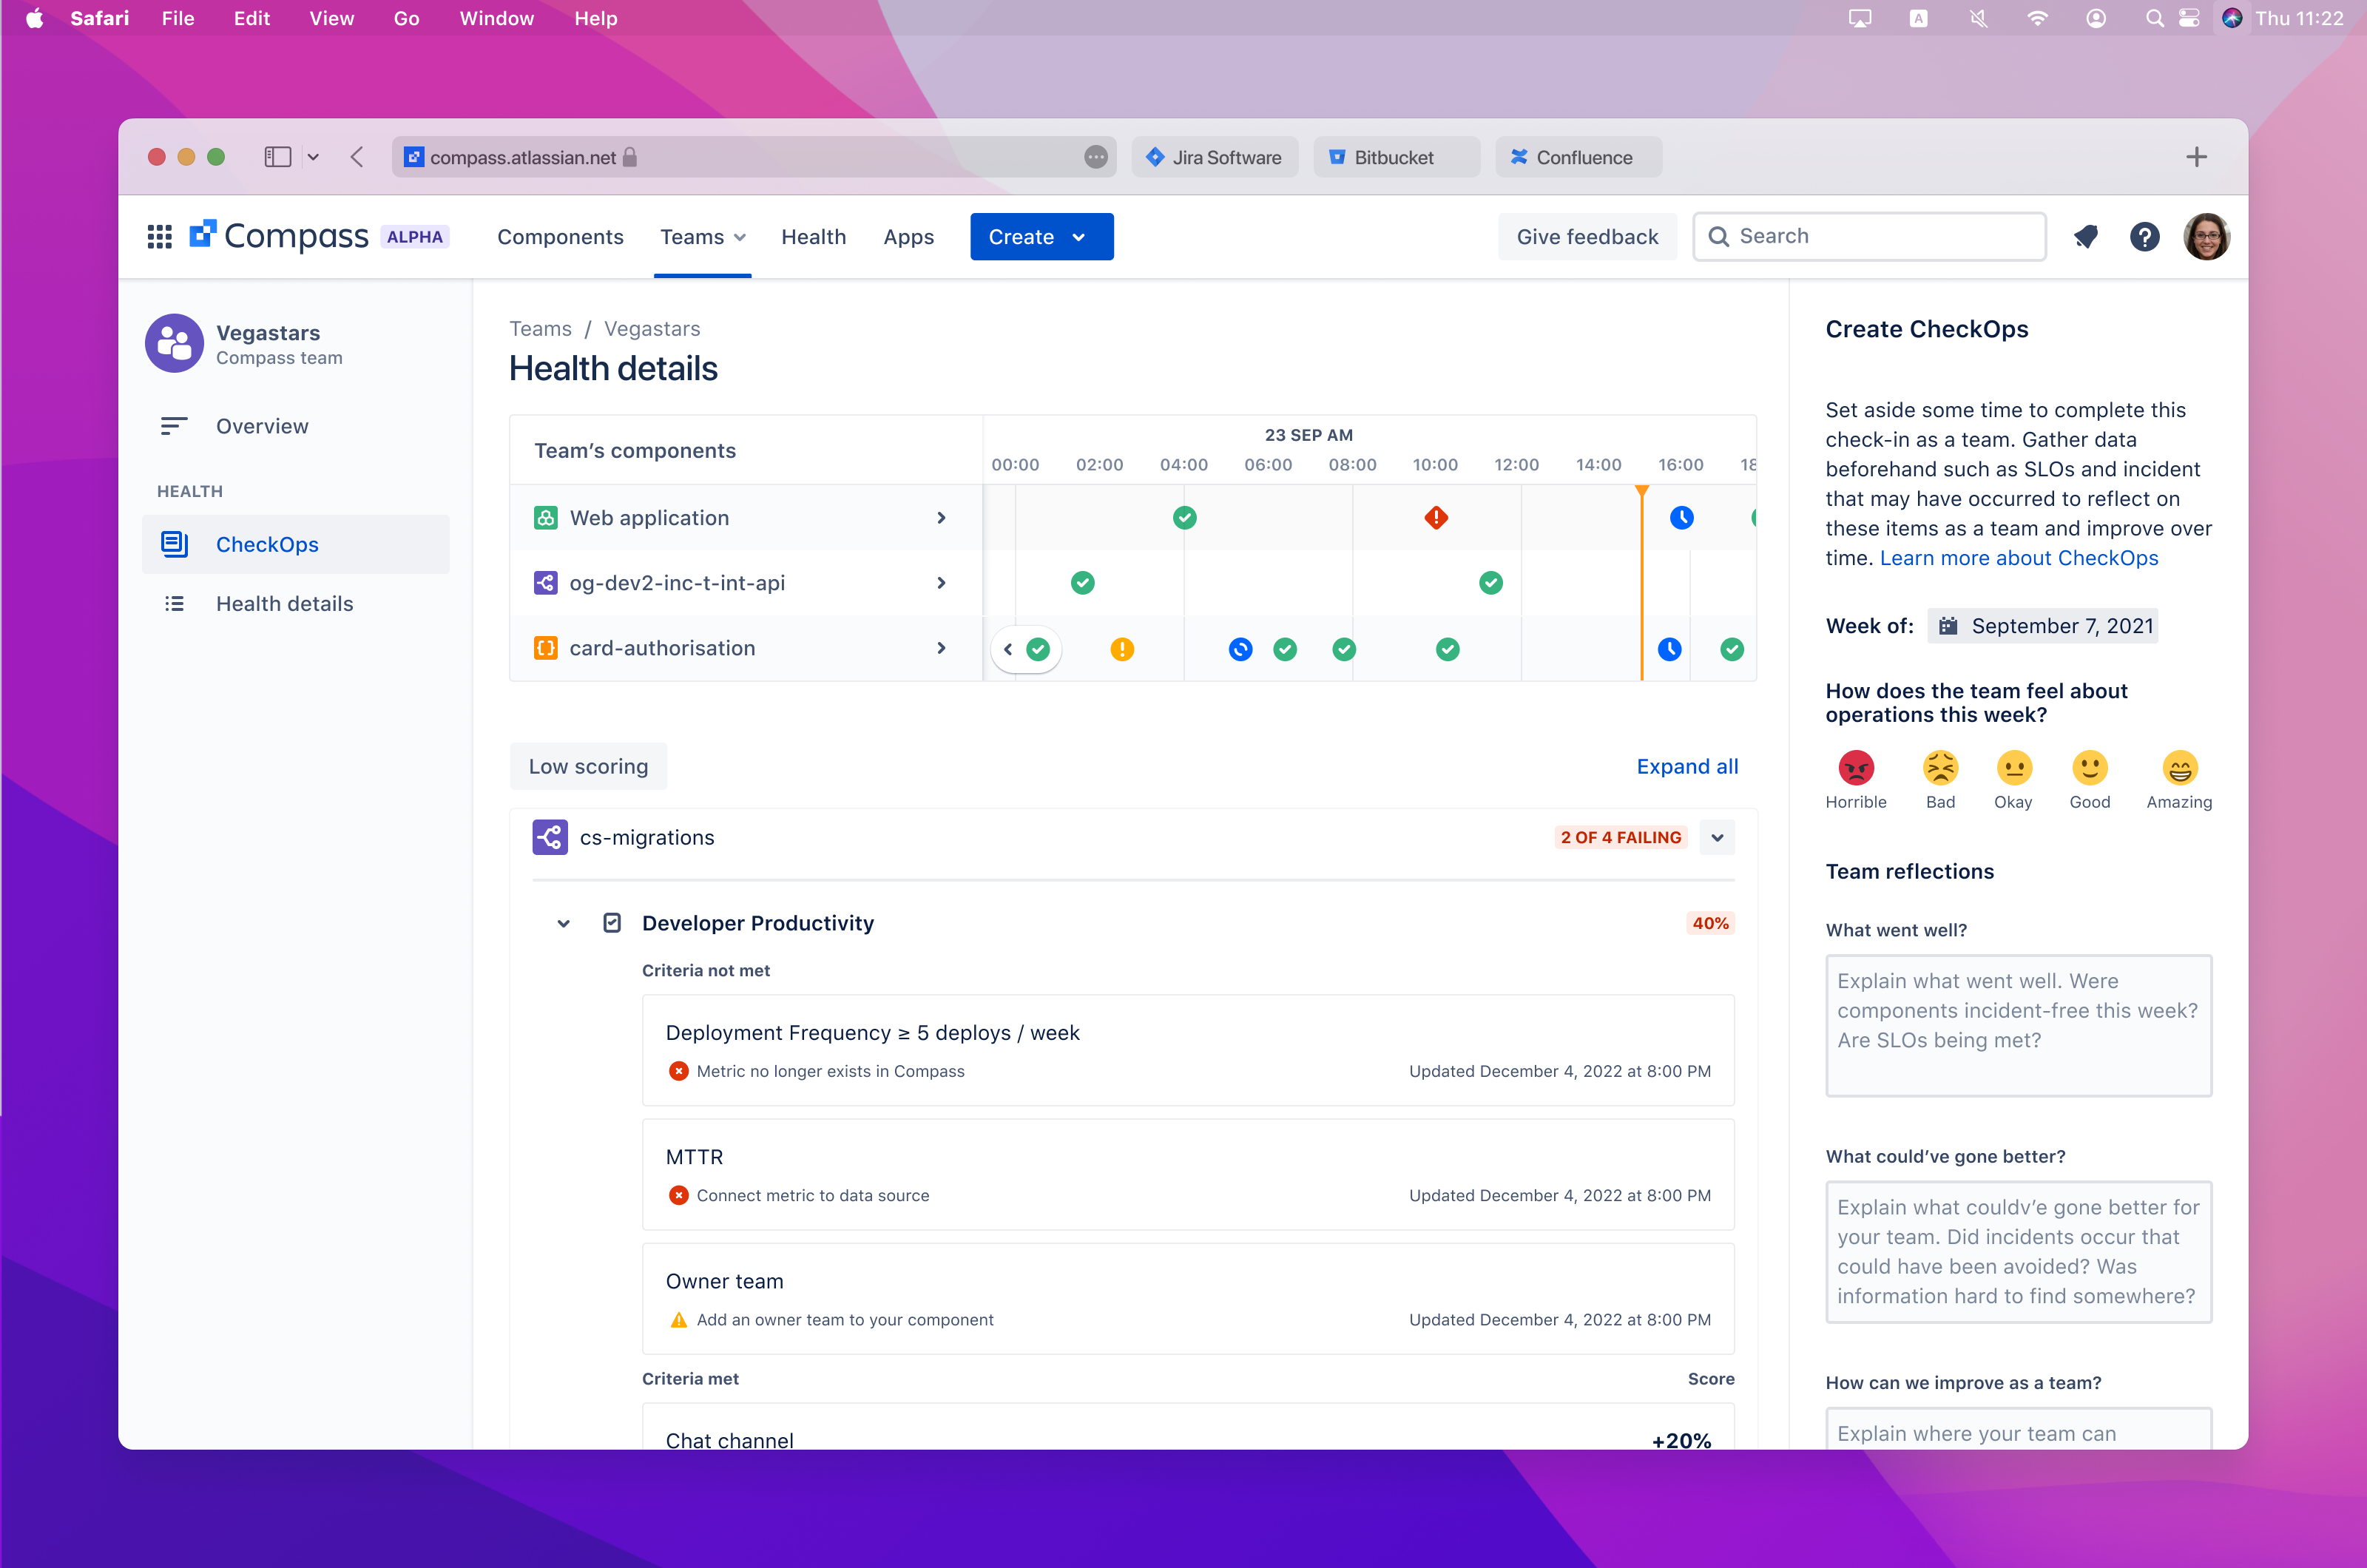
Faster path to improvement

Failed and passing criteria are separated and prioritized so engineers can immediately see what’s blocking compliance and where to focus fixes first.

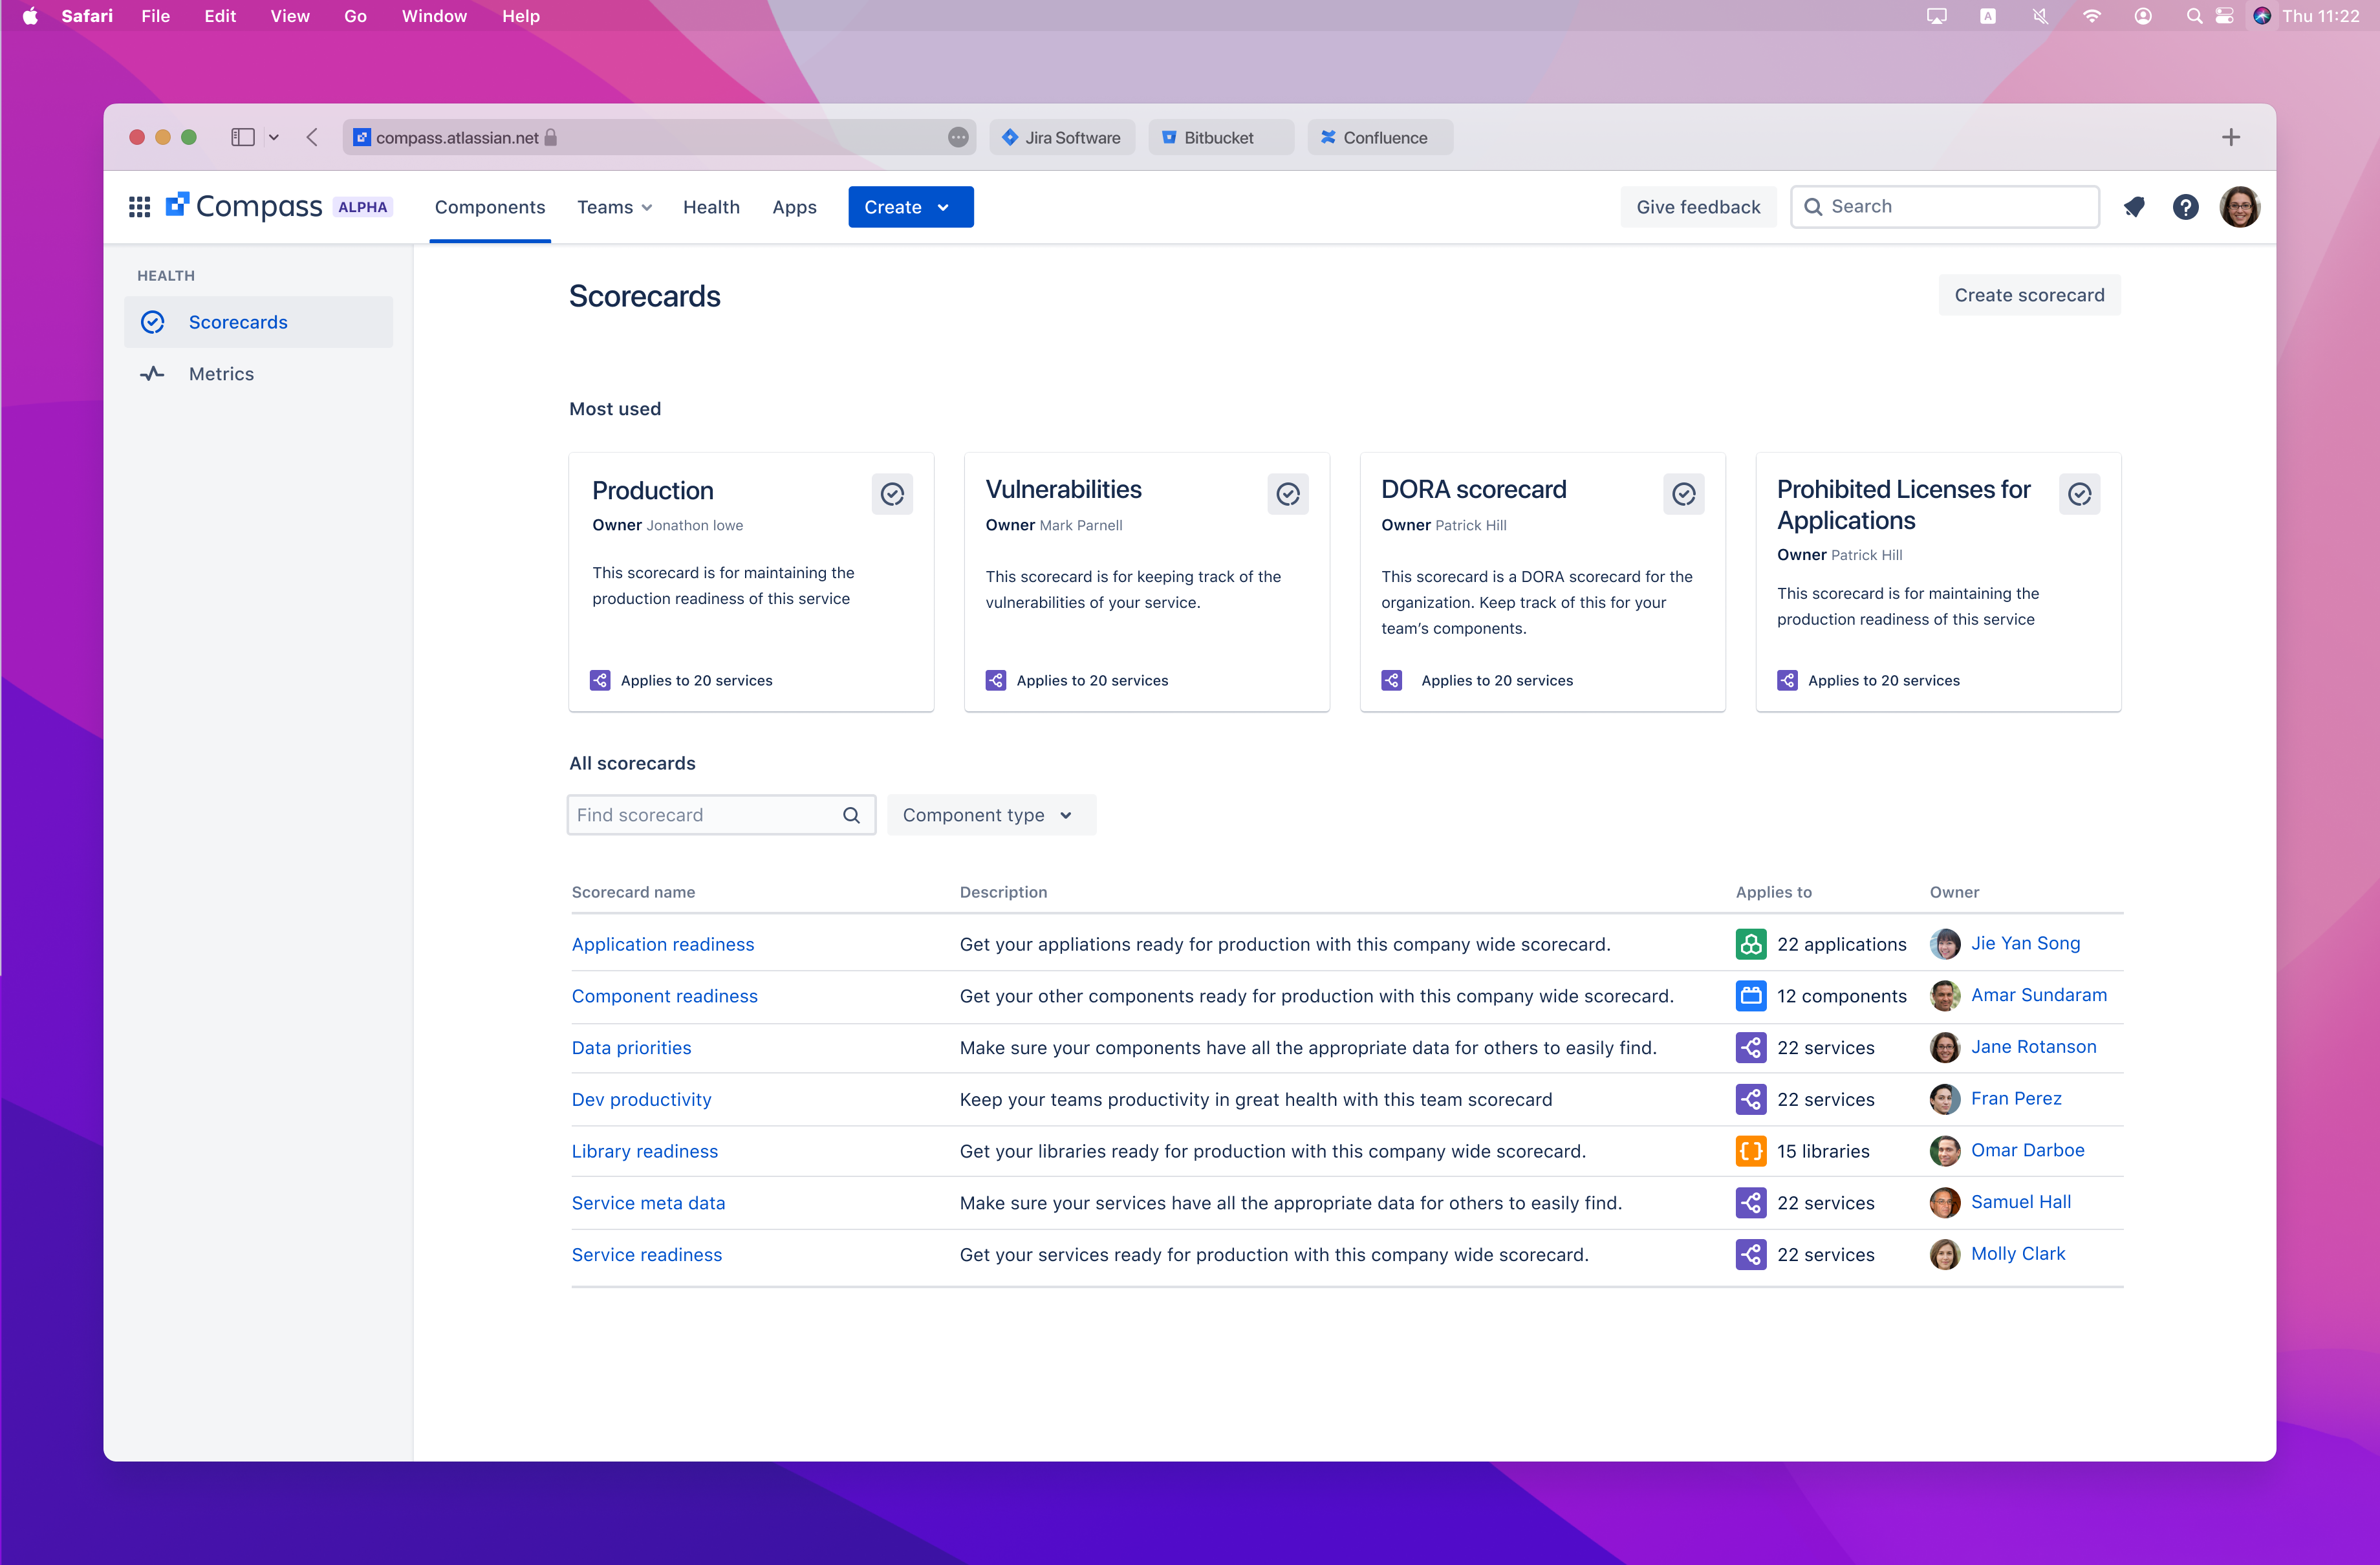
Clear responsibility & reach

Ownership, labels, and component coverage are visible up front, helping teams quickly identify who is accountable and how broadly a scorecard applies before taking action.